Clustering#
Thresholding apply well on a grayscale image, for which it is easy to define a threshold from the modes of the histogram. However, this approach cannot be applied on a color or multiband image because there is no histogram. Each pixel in a \(B\)-band image can be represented by a point in a \(B\)-dimensional space. By doing so, pixels with similar colors form groups in the space, as illustrated in Fig. 79.

Fig. 79 Showing the pixels of a color image in a \(B\)-dimensional space.#
Clustering methods consists in defining groups of pixels. Therefore, all the pixels in the same group define a class in the segmented image.
A classical clustering method for image segmentation is the k-means method (French: k-moyennes).
The k-means algorithm [Steinhaus 1957, MacQueen 1967] is an iterative method that affects every point in the space \(\mathbb{R}^B\) to a group (called cluster). The number \(K\) of groups is chosen by the user. In the sequel, the centroid defines the center of a group. Its coordinates are the mean of the coordinates of the points in the group.
The algorithm is given below.
Initialize (randomly) the \(K\) centroids
While the centroids vary:
STEP A For each point:
Calculate the distances from the point to all centroids
Assign the point to the nearest group
STEP B Calculate the centroid of each group
Fig. 80 illustrate this algorithm, in the simple case of an image with two bands (hence the two-dimensional space) segmented into \(K=2\) classes.

Fig. 80 Illustration of the k-means algorithm (click to enlarge).#
Fig. 81 gives the result of the k-means algorithm on an image.
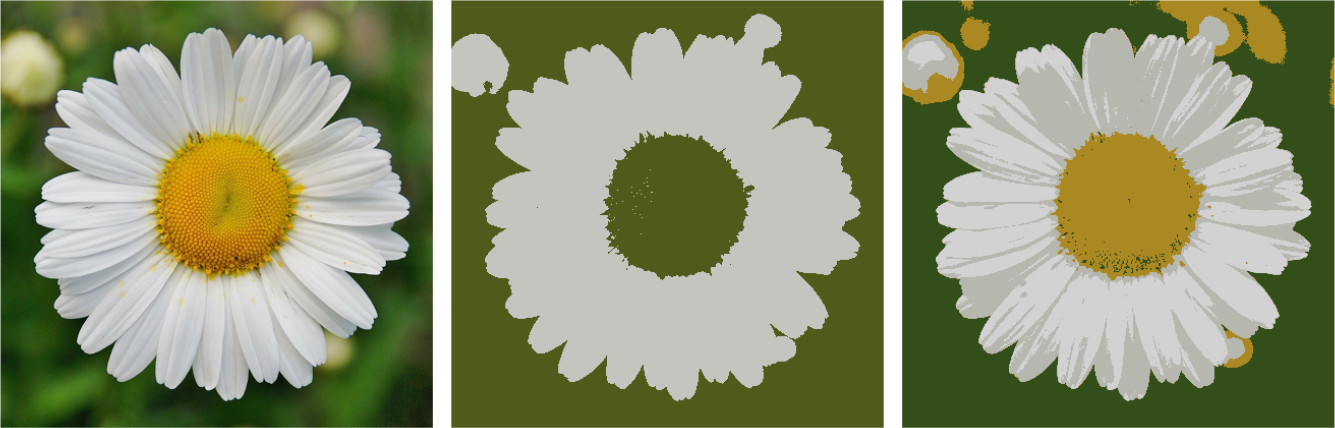
Fig. 81 Segmentation with the k-means algorithm on the left image (center: \(K=2\) classes, right: \(K=4\) classes).#
The pros and cons of the k-means method for image segmentation are listed below.
simplicity
easy to implement
generally fast
works correctly when the clusters are spherical*
requires to know the number of classes
sensitive to initialization
can be slow in large dimensions
fails for non-spherical structures*
sensitive to outliers*
The characteristics above identified with * are now detailed.
Because the k-means algorithm performs the grouping with respect to the distance of the points to the centroids, it assumes that the groups are spherical. Therefore, the algorithm works well for spherical clusters, but it fails if the clusters are not spherical, as depicted in the images below.

Fig. 82 Spherical clusters: the k-means algorithm works well. The points are depicted by \(\bullet\) whose color correspond to the class, and the centroids are depicted by a black \(\times\).#

Fig. 83 Non-spherical clusters: the k-means algorithm fails.#
In addition to this, the centroids are calculated as the mean of the points in the cluster. But the mean is not a robust estimation and is sensitive to points located far from the group. Thus, the algorithm may fail in the presence of outliers (valeurs aberrantes).

Fig. 84 Presence of outliers: the k-means algorithm fails in this example.#
Other clustering methods are available to avoid some of the aforementionned limits. We can cite for example Gaussian mixture modeling or Mean-shift.