Displaying an image needs to convert the pixel intensities into gray levels or colors. Screens are basically a matrix of pixels, each composed of red, green and blue luminophores (the shape, size and number of luminophores depends on the technology). Colors can be recreated by adjusting the luminophore intensities, thanks to the principles of additive color mixing (see Figure 1). The correspondence between the numerical value of the intensities and colors on the screen is visually represented by a colormap.
Displaying a 2D grayscale image
A 2D grayscale image is an array with dimensions where each pixel contains a scalar (). Therefore, each pixel is displayed with a specific gray level. Figure 1 shows the same image with different colormaps. As you can see, the choice of the colormap changes the perception of the colors, even though the information contained by the pixels remains unchanged.
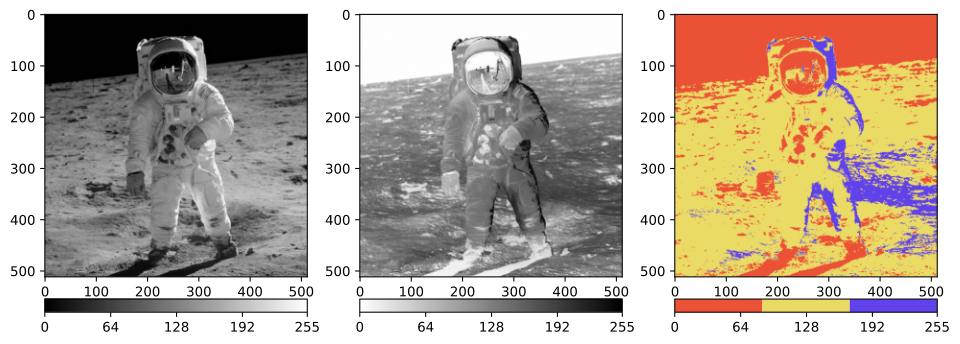
Figure 1:An image showing Buzz Aldrin displayed with the colormaps given below the images.
Note that the 3 images in Figure 1 are all grayscale images, even if one is displayed with colors.
Colormaps are sometimes useful to bring out dark objects in an image with poor contrast. The image below, with the usual “gray” colormap, clearly shows one bright spot but not the four other faint spots. Instead, the “jet” colormap makes the faint spots visible. Also, displaying the logarithm of the image helps to make the spots visible (see P:histogram-transformations).
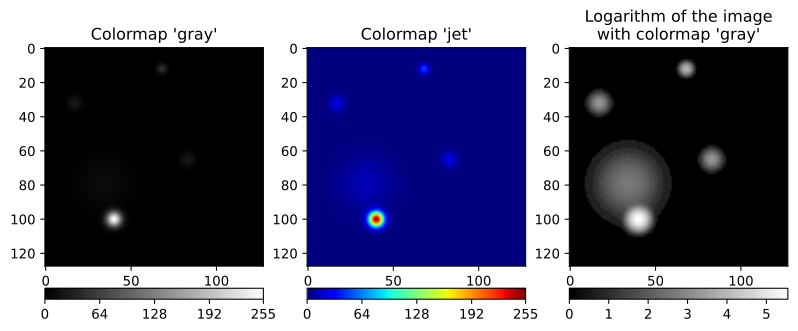
Figure 2:An image of spots displayed with differente colormaps.
Displaying a 2D color image
As we have seen in Image acquisition, the retina of human eye contains three kinds of cone cells which are basically sensitive to blue, green and red light. So, a color image is simply a composition of the intensities of these three wavelengths, so that . Each of these three bands codes the intensity of red, green and blue light of the image, hence the name RGB (red, green, blue). This is why digital screens are made of red, green and blue luminophores.
Displaying other types of images
There is no straightforward way to display an image which is neither a 2D grayscale nor RGB image. Such images are either not displayed, or displayed by using a specific representation. For example, only three bands can be selected and displayed as an RGB image. Another possibility is to gather the bands into three groups and compute the mean within each group, these means becoming the three bands of a standard RGB image.