Histogram thresholding is a very basic method for segmenting grayscale images based on the pixel intensities.
Binary thresholding
Binary thresholding consists in associating each pixel of the image to a binary number which depends on the intensity of the pixels and on a threshold (French: seuil) :
This method is called “binarization” (French: binarisation). It gives a segmentation into two classes, depending on the intensity of the pixels of a grayscale image (Figure 1).
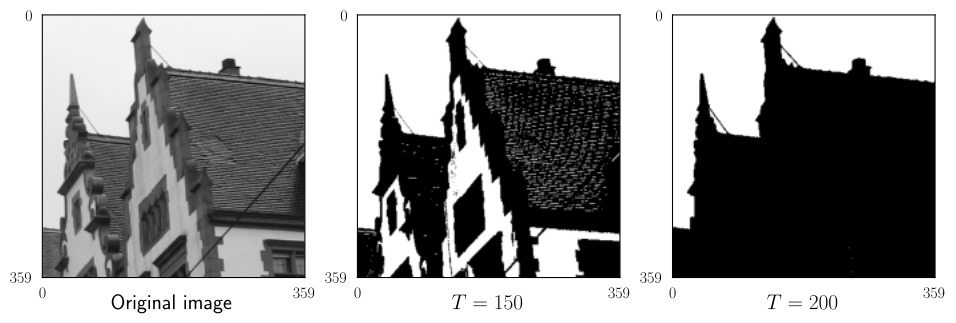
Figure 1:Example of binarization for two thresholds.
Because the segmentation depends on the value of , the histogram can be very useful. As an example, Figure 2 gives the histogram of the previous image, with the chosen thresholds.
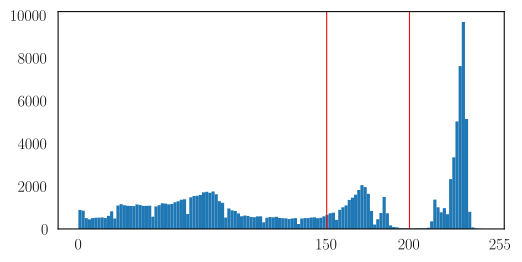
It would be useful to have an automatic process to define the threshold. Several methods exist but Otsu’s method is the most famous automatic method for histogram thresholding.
Otsu’s method
Binarization divides the image histogram in two groups, namely class 0 and class 1, as illustrated Figure 3.
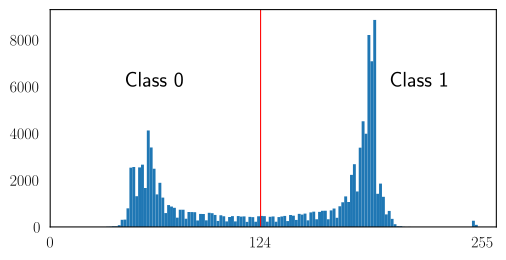
Figure 3:An histogram and a threshold .
Each group has a number of pixel with mean and variance , where is the group index. Otsu’s method [Otsu 1979] computes the threshold which minimizes the intra-class variance (also known as the within-class variance), defined as the weighted mean of the variances of each class:
Considering the intensities to lie in and being the histogram, we have:
For class 1:
For class 2:
The algorithm to determine the value of that minimize is simple: the intra-class variance is calculated for all the thresholds , and the one that gives the lowest value for is returned.
An example of Otsu’s thresholding is given Figure 4.
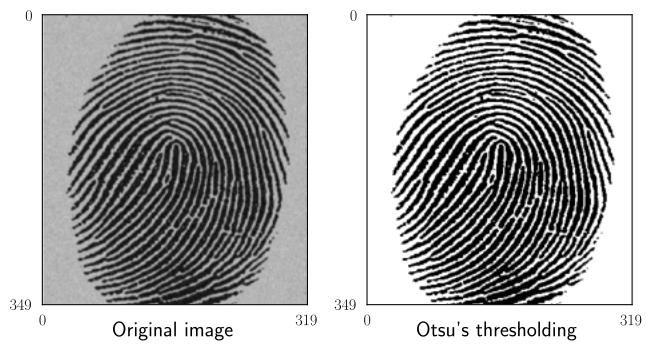
Figure 4:Result of Otsu’s segmentation.
Multiple thresholds
An image can be segmented in more than two classes by defining several thresholds (Figure 5). In particular, Otsu’s method can be extended to several thresholds, but the computational complexity (hence the computation time) increases greatly with the number of classes!
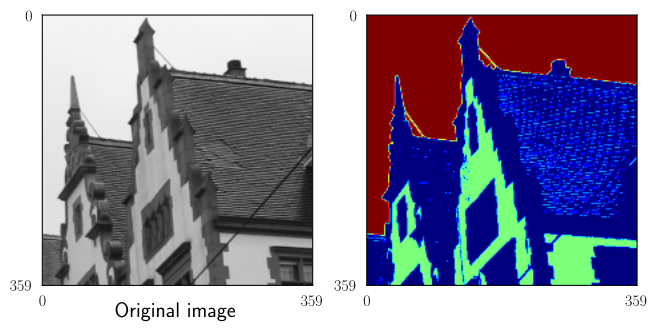
Figure 5:Several thresholds are applied to an image to get several classes (shown in colors).